discretize.View.TensorView
-
class
discretize.View.TensorView[source]¶ Bases:
objectProvides viewing functions for TensorMesh
This class is inherited by TensorMesh
Attributes
Methods
-
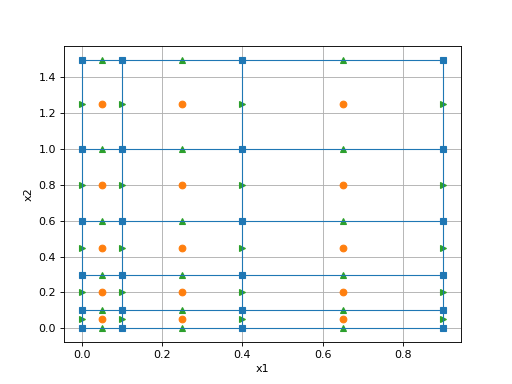
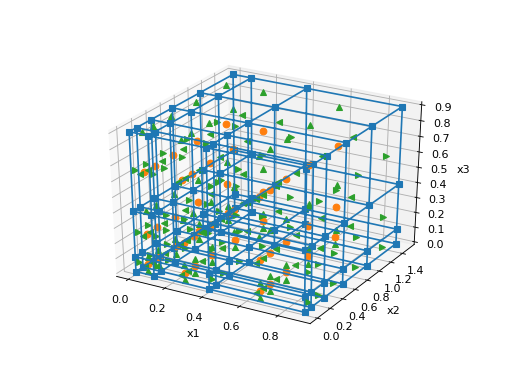
TensorView.plotGrid(ax=None, nodes=False, faces=False, centers=False, edges=False, lines=True, showIt=False, **kwargs)[source]¶ Plot the nodal, cell-centered and staggered grids for 1,2 and 3 dimensions.
Parameters: import discretize import numpy as np h1 = np.linspace(.1, .5, 3) h2 = np.linspace(.1, .5, 5) mesh = discretize.TensorMesh([h1, h2]) mesh.plotGrid(nodes=True, faces=True, centers=True, lines=True, showIt=True)
import discretize
import numpy as np
h1 = np.linspace(.1, .5, 3)
h2 = np.linspace(.1, .5, 5)
h3 = np.linspace(.1, .5, 3)
mesh = discretize.TensorMesh([h1, h2, h3])
mesh.plotGrid(nodes=True, faces=True, centers=True, lines=True, showIt=True)
-
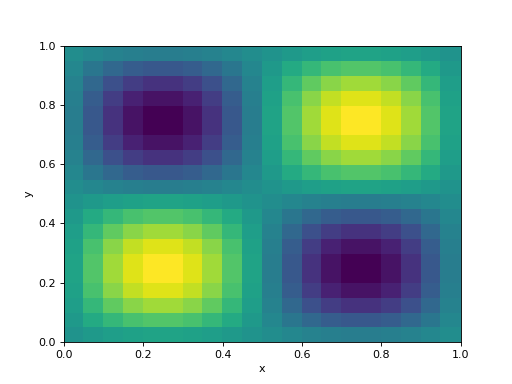
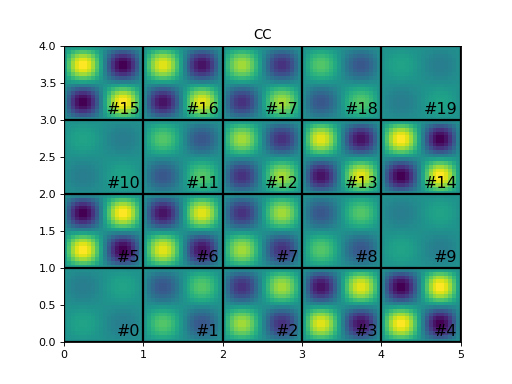
TensorView.plotImage(v)[source]¶ Plots scalar fields on the given mesh.
Input:
Parameters: v (numpy.ndarray) – vector Optional Inputs:
Parameters: - vType (str) – type of vector (‘CC’, ‘N’, ‘F’, ‘Fx’, ‘Fy’, ‘Fz’, ‘E’, ‘Ex’, ‘Ey’, ‘Ez’)
- ax (matplotlib.axes.Axes) – axis to plot to
- showIt (bool) – call plt.show()
3D Inputs:
Parameters: import discretize import numpy as np M = discretize.TensorMesh([20, 20]) v = np.sin(M.gridCC[:, 0]*2*np.pi)*np.sin(M.gridCC[:, 1]*2*np.pi) M.plotImage(v, showIt=True)
import discretize
import numpy as np
M = discretize.TensorMesh([20, 20, 20])
v = np.sin(M.gridCC[:, 0]*2*np.pi)*np.sin(M.gridCC[:, 1]*2*np.pi)*np.sin(M.gridCC[:, 2]*2*np.pi)
M.plotImage(v, annotationColor='k', showIt=True)
-
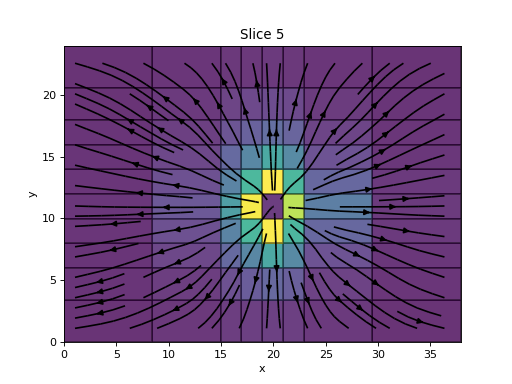
TensorView.plotSlice(v, vType='CC', normal='Z', ind=None, grid=False, view='real', ax=None, clim=None, showIt=False, pcolorOpts=None, streamOpts=None, gridOpts=None, range_x=None, range_y=None, sample_grid=None, stream_threshold=None, stream_thickness=None)[source]¶ Plots a slice of a 3D mesh.
-
TensorView.plot_3d_slicer(v, xslice=None, yslice=None, zslice=None, vType='CC', view='real', axis='xy', transparent=None, clim=None, aspect='auto', grid=[2, 2, 1], pcolorOpts=None)[source]¶ Plot slices of a 3D volume, interactively (scroll wheel).
If called from a notebook, make sure to set
%matplotlib notebookSee the class discretize.View.Slicer for more information.
It returns nothing. However, if you need the different figure handles you can get it via
fig = plt.gcf()and subsequently its children via
fig.get_children()and recursively deeper, e.g.,
fig.get_children()[0].get_children().