discretize.View.Slicer
-
class
discretize.View.Slicer(mesh, v, xslice=None, yslice=None, zslice=None, vType='CC', view='real', axis='xy', transparent=None, clim=None, aspect='auto', grid=[2, 2, 1], pcolorOpts=None)[source]¶ Bases:
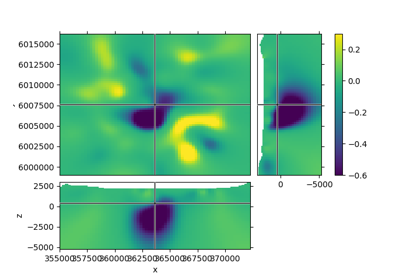
objectPlot slices of a 3D volume, interactively (scroll wheel).
If called from a notebook, make sure to set
%matplotlib notebookThe straight forward usage for the Slicer is through, e.g., a TensorMesh-mesh, by accessing its mesh.plot_3d_slicer.
If you, however, call this class directly, you have first to initiate a figure, and afterwards connect it:
>>> # You have to initialize a figure
>>> fig = plt.figure()
>>> # Then you have to get the tracker from the Slicer
>>> tracker = discretize.View.Slicer(mesh, Lpout)
>>> # Finally you have to connect the tracker to the figure
>>> fig.canvas.mpl_connect('scroll_event', tracker.onscroll)
>>> plt.show()
Parameters
- v : array
- Data array of length self.nC.
- xslice, yslice, zslice : floats, optional
- Initial slice locations (in meter); defaults to the middle of the volume.
- vType: str
- Type of visualization. Default is ‘CC’. One of [‘CC’, ‘Fx’, ‘Fy’, ‘Fz’, ‘Ex’, ‘Ey’, ‘Ez’].
- view : str
- Which component to show. Defaults to ‘real’. One of [‘real’, ‘imag’, ‘abs’].
- axis : ‘xy’ (default) or ‘yx’
- ‘xy’: horizontal axis is x, vertical axis is y. Reversed otherwise.
- transparent : ‘slider’ or list of floats or pairs of floats, optional
- Values to be removed. E.g. air, water. If single value, only exact matches are removed. Pairs are treated as ranges. E.g. [0.3, [1, 4], [-np.infty, -10]] removes all values equal to 0.3, all values between 1 and 4, and all values smaller than -10. If ‘slider’ is provided it will plot an interactive slider to choose the shown range.
- clim : None or list of [min, max]
- For pcolormesh (vmin, vmax).
- aspect : ‘auto’, ‘equal’, or num
Aspect ratio of subplots. Defaults to ‘auto’.
A list of two values can be provided. The first will be for the XY-plot, the second for the XZ- and YZ-plots, e.g. [‘equal’, 2] to have the vertical dimension exaggerated by a factor of 2.
- WARNING: For anything else than ‘auto’, unexpected things might happen
- when zooming, and the subplot-arrangement won’t look pretty.
- grid : list of 3 int
- Number of cells occupied by x, y, and z dimension on plt.subplot2grid.
- pcolorOpts : dictionary
- Passed to pcolormesh.