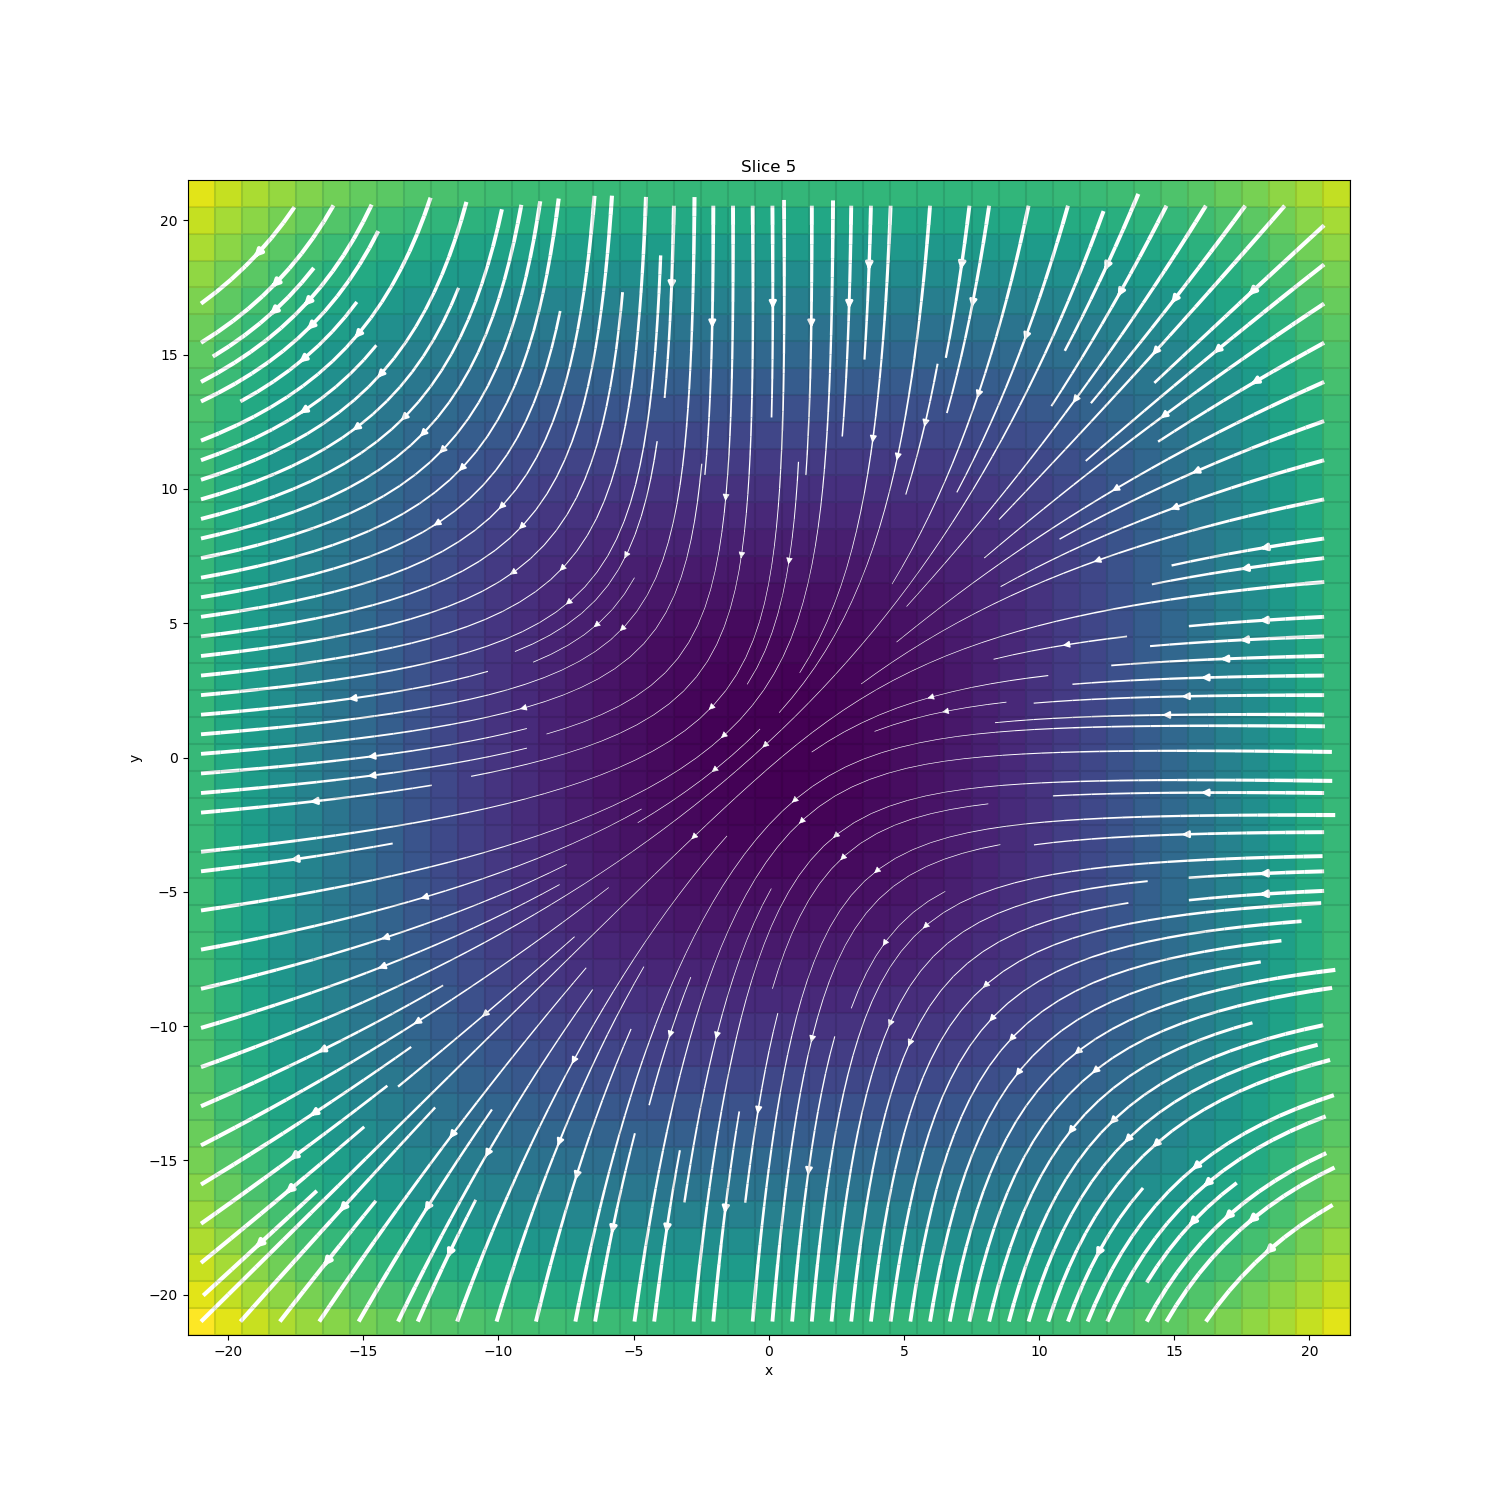
Plotting: Streamline thickness
A simple example to vary streamline thickness based on the vector amplitudes
Author: @micmitch <https://github.com/micmitch>
import numpy as np
import matplotlib.pyplot as plt

from discretize import TensorMesh
Create mesh
Minimum cell size in each direction
dx = 1.
dy = 1.
dz = 1.

# Number of core cells in each direction
nCoreX = 43.
nCoreY = 43.
nCoreZ = 43.

# Cell widths
hx = [(dx,nCoreX)]
hy = [(dy,nCoreY)]
hz = [(dz,nCoreZ)]

# Desired Core mesh origin (Bottom SW corner)
x0 = -21.5
y0 = -21.5
z0 = -21.5

mesh = TensorMesh([hx, hy, hz],[x0,y0,z0])
print(mesh.nC)
Out:
79507
Define arbitrary function to plot
X = mesh.gridCC[:,0]
Y = mesh.gridCC[:,1]
Z = mesh.gridCC[:,2]

U = -1 - X**2 + Y + Z
V = 1 + X - Y**2 + Z
W = 1 + X + Y - Z**2
Plot streamlines
Create figure
fig = plt.figure()
ax = plt.subplot(111)
fig.set_figheight(15)
fig.set_figwidth(15)
labelsize = 30.
ticksize = 30.

# Create data vector
dataVec = np.hstack([U,V,W])
print(dataVec.shape)

# Set streamline plotting options
streamOpts = {'color':'w', 'density':2.0}
pcolorOpts = {"cmap":"viridis"}

dat = mesh.plotSlice(
    dataVec, ax=ax, normal='Z', ind=5, vType='CCv', view='vec',
    streamOpts=streamOpts, gridOpts={"color":"k", "alpha":0.1}, grid=True,
    clim=None, stream_thickness=3
)
Out:
(238521,)
Moving Forward
If you have suggestions for improving this example, please create a pull request on the example in discretize
Total running time of the script: ( 0 minutes 1.298 seconds)